State Performance Plan / Annual Performance Report
Under the Individuals with Disabilities Education Improvement Act of 2004 (IDEA), states are required to report the progress of students with disabilities in important areas of performance. This page provides important information about the Rhode Island Performance Report.
State Performance Plan 2021-2025 Target Setting Information - Feedback Requested
The Individuals with Disabilities Education Act (IDEA) requires each state to develop a state performance plan/annual performance report (SPP/APR) that evaluates the state’s efforts to implement the requirements and purposes of the IDEA and describes how the state will improve its implementation. The SPP/APRs include indicators that measure child and family outcomes and other indicators that measure compliance with the requirements of the IDEA.
RIDE is soliciting input for the performance measures of the state performance plan (SPP). RIDE has analyzed data, examined trends in performance and has set draft targets for the 17 Indicators established by the US Department of Education. Data visualizations of these Indicators are available.
RIDE is seeking the input of stakeholders with a vested interest in these measures and invites interested individuals to submit comments to Susan.Wood@ride.ri.gov on or before January 15, 2022.
Annual Performance Report (FFY 2023)
- Annual Performance Report - FFY 2023
- Annual Performance Report - FFY 2022
- Rhode Island Determination Letter- FFY 2022
- Annual Performance Report - FFY 2021
- Rhode Island Determination Letter - FFY 2021
- Annual Performance Report - FFY 2020
District State Performance Plan (SPP) Reporting
The State shall report annually to the public on the performance of each local educational agency (LEA) located in the State on the targets in the State's Performance Plan.
SPP Public Reporting Data Visualizations
- Data Visualizations
- State Systemic Improvement Plan (SSIP)
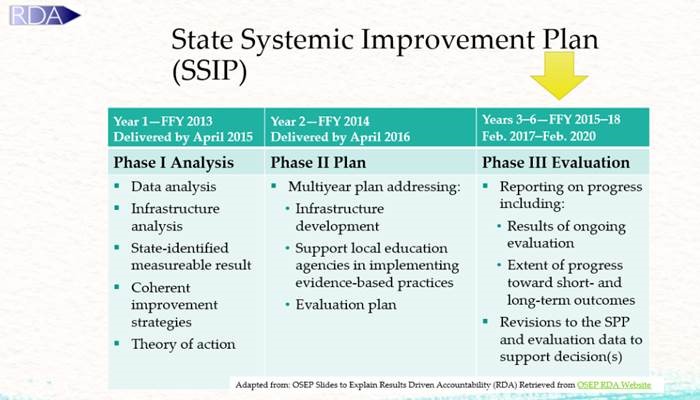
The State Systemic Improvement Plan (SSIP) is a comprehensive, multi-year plan that focuses on improving results for children with disabilities within OSEP's focus on Result Driven Accountability (RDA). SSIP development included data analysis, infrastructure analysis, a state-identified measurable result, the selection of coherent improvement strategies, and a theory of action. RI reports annually on progress with the SSIP to OSEP in the Rhode Island State Performance Plan as Indicator 17.
| YEAR 1 - FFY 2013 DELIVERED BY APRIL 2015 |
YEAR 2 - FFY 2014 DELIVERED BY APRIL 2016 |
YEARS 3-6 - FFY 2015-18 FEBRUARY 2017 TO FEBRUARY 2020 |
|---|---|---|
| Phase I Analysis | Phase II Plan | Phase III Evaluation |
|
|
|
View an image of the above table.
Project Website
RI Intensive Math Intervention Project
Professional Learning
Free online modules to support math improvement for students , including students with disabilities, is available online at BRIDGE-RI.
Instructional Handouts
These handouts are concise and explicit how-to instruction for teachers to implement specific math strategies with students. Please also see the project website for additional resources.
- Cover-Copy-Compare
- CRA: Helping Students with Transitioning from Visual to Abstract Understanding
- Fluency-Practice: Distributive, Cumulative, and Interleaved Practice
- Word Problems - Schema-Based Instruction (SBI) Additive Change
- Word Problems - Schema-Based Instruction (SBI) Additive Combine
- Word Problems - Schema-Based Instruction (SBI) Additive Compare
- Word Problems - Schema-Based Instruction (SBI) Multiplicative Comparison
- Word Problems - Schema-Based Instruction (SBI) Multiplicative Equal Groups
Tools for Parents and Families
Infographic tip sheets in English and Spanish
- Help with Math Homework - English Spanish
- Help with Word Problems - English Spanish
- Help with Addition and Subtraction Word Problems - English Spanish
- Help with Multiplication and Division Word Problems - English Spanish
- Intensive Intervention Overview
- Questions Parents and Families Can Ask
- Tips for Families: How Can You Support Intensive Intervention?
If...
... supports are provided for data-based decision making to inform intensive, individualized instruction in mathematics throughout the state,
then...
... LEAs and schools will change systems and adult behaviors to increase their capacity to improve the proficiency level of students with disabilities, so that
... we will reach our student achievement goal!
We hypothesize that improving intensive and individualized instruction within a systematic framework of culturally and linguistically responsive supports for students with disabilities, particularly elementary Grades 3-5 Hispanic and Black children with specific learning disabilities in urban settings, will improve their performance on State assessments of math by 4% by Federal Fiscal Year 2018.
SiMR: Improve the mathematics achievement for Hispanic and Black students with specific learning disabilities in Grades 3-5 by 4% by fiscal year 2018 (2018-19) on the statewide assessment.
| Activities | Outputs | Short-Term Outcomes | Intermediate Outcomes | Long-Term Outcomes |
|---|---|---|---|---|
|
Provide Training in Math Provide Training in Data-Based Individualization (DBI) Provide Coaching TA & Support to Implement Engage Parents & Families Align RIDE Initiatives as Appropriate |
Training & TA Tracking System Coaching Logs School Improvement Plans Parent-School Communications Artifacts from State Agencies |
Increased educator knowledge of DBI for math
Increased parent or family awareness of intensive intervention and how to support their child |
Increased educator application of skills related to DBI for math
Improved communication, coordination, collaboration, and alignment of RIDE initiatives |
Improved formative assessment outcomes for students receiving intensive math intervention Improved fidelity of school-level implementation of MTSS Improved LEA capacity to support, scale, and sustain improvement efforts in urban settings and with diverse population |
If professional learning and coaching are provided on delivery of accessible, evidence-based math instruction, including data-based individualization (DBI), throughout the state,
Then LEAS and schools will change systems and adult behaviors to improve teacher and leader knowledge of and capacity to implement evidence-based math instruction across the Tiers of MTSS and within specially designed instruction (SDI) so that
Students with IEPs will demonstrate increased outcomes on math growth data, math screening and progress monitoring data.
|
Activities |
Outputs |
Short-term outcomes |
Intermediate outcomes |
Long-term outcomes |
|
Provide training and resources on evidence-based math instruction across the Tiers of MTSS through an online learning management system Provide training and resources on DBI through an online learning management system Provide training and resources on defining and delivering of SDI while supporting general education access to evidence-based math instruction Provide virtual and in person coaching of teams on DBI and SDI Engage parents and families and broader stakeholders as active team members |
Statewide access to training and resources in a delivery system that is efficient and flexible scheduled by LEAs Training and TA tracking system Coaching logs School/district improvement Plans aligned to SSIP RIDE tools and guidance that supports SSIP Training and TA tracking system Coaching logs, implementation interviews, fidelity measures Parent school communications on student data and strengths; online resources on math instruction; engagement surveys and focus groups |
Increased educator knowledge of evidence-based math instruction at varying levels of intensity of instruction from Tier 1 to DBI to SDI Increased educator knowledge of collaboration and teaming practices to ensure access to core-math instruction as well as to individualization based on data-use Increased parent or family awareness of evidence-based math instruction and student progress across the tiers of MTSS |
Increased educator application of skills related to evidence-based math instruction Improved teaming structures to facilitate collaboration and DBI Screening and progress monitoring are implemented with fidelity SDI is progress monitored with fidelity Improved parent and stakeholder beliefs about math instruction |
Improved formative and summative assessment outcomes in math for students with IEPs Improved fidelity of school-level implementation of MTSS and SDI across a growing number of LEAs Improved stakeholder engagement to support improved math outcomes for students with IEPs |
|
Logic Model Outcome |
Evaluation Question |
Data source/evidence |
|
Increased educator knowledge of evidence-based math instruction at varying levels of intensity of instruction from Tier 1 to DBI to SDI
|
To what extent did educator knowledge of evidence-based math instruction at varying levels of intensity of instruction from Tier 1 to DBI to SDI change? |
Needs assessment Training evaluations End-of-year (EOY) pulse check |
|
Increased educator knowledge of collaboration and teaming practices to ensure access to core-math instruction as well as to individualization based on data-use |
To what extent did educator knowledge of collaboration and teaming practices, to ensure access to core-math instruction as well as to individualized instruction based on data-use, change? |
Training evaluations Observational tool EOY pulse check Training implementation surveys |
|
Increased parent or family awareness of evidence-based math instruction across the tiers of MTSS |
|
Needs assessment EOY pulse check Site-level dissemination of toolkit resources RIPIN web traffic |
|
Increased educator application of skills related to evidence-based math instruction
|
To what extent have intensive mathematics intervention and instructional practice changed adult behavior and practice in participating schools? |
Training evaluations Observational tool EOY pulse check Training implementation surveys |
|
Increased educator, family, and stakeholder beliefs of mathematics (short term) |
To what extent did educator beliefs about mathematics instruction change? To what extent did family and stakeholder beliefs about mathematics instruction change? |
Math Beliefs Surveys
|
|
Improved formative and summative assessment outcomes in math for students with IEPs |
To what extent have the implementation of intensive mathematics intervention and instruction practices improved student results? |
Universal screening data Progress monitoring data State assessment growth data |
|
Improved fidelity of school-level implementation of MTSS and SDI including screening and progress monitoring across a growing number of LEAs |
To what extent did schools implement MTSS and DBI in mathematics with fidelity? |
Needs assessment EOY pulse check Observational tool |
|
Improved stakeholder engagement to support improved math outcomes for students with IEPs |
To what extent do school level stakeholders report feeling engaged in the ongoing implementation and evaluation of the project?
|
Stakeholder engagement survey |
Review previous State Performance Plans/Annual Performance Reports (SPP/APR)
For previous State Performance Plans/Annual Performance Reports (SPP/APR) please contact Susan Wood at (401) 222-8992.