Attendance Matters RI
Use the hashtags #AttendanceMattersRI and #Cool2BeInSchoolRI to share how you're working to reduce chronic absenteeism. Additional resources can be found on www.attendancemattersri.org.

School attendance is a powerful predictor of student outcomes. Rhode Island defines chronic absenteeism as the percentage of students who miss 10% or more of school days during the year (or two days per month). Research shows that chronic absenteeism is associated with a number of negative consequences for students, including lower achievement, disengagement from school, course failure, and an increased risk of dropping out. Attendance each day is even more critical to help get students on track in the wake of the pandemic. We know some absences are unavoidable, but any absence makes it more difficult for children to keep up with the daily learning needed to grow and succeed. Absences may also speak to larger issues around school climate, which is why it is important schools use their data to problem solve and provide students with necessary support and interventions.
While more work remains ahead to continue to curb chronic absenteeism, under the statewide, cross-sector #AttendanceMattersRI campaign, chronic absenteeism during the 2023-2024 school year declined approximately 4.2 percentage points, bringing the statewide chronic absenteeism rate from 28.9% in school year 2022-2023 to 24.7%. This represents 244,375 fewer absences, achieving a nearly 10 percentage point drop from the 2021-2022 school year when 34.1% of students were chronically absent statewide. This reduction in absences represents approximately 1,344,063 additional learning hours for Rhode Island students.
The latest data shows that 57 of 64 local education agencies (LEAs) have decreased their chronic absenteeism rates with 89% seeing an improvement. At the school level, 241 of 294 schools, accounting for 82%, have seen a decrease. To assist school leaders in addressing chronic absenteeism, RIDE staff in partnership with the Governor’s Innovation Office developed the Attendance Tool in 2018. Unique to this suite of tools is the Attendance Nudge, a mobile application which allows principals to communicate with families when student absences become a concern. Piloted in East Providence, the Attendance Tool is now used in more than 261 schools across 59 school districts.
- NEW! Long-term Attendance and Achievement Data Visualizations
- NEW! Professional Learning Opportunity (2 PLUs): Preventing Chronic Absenteeism
- Press Release: McKee, Infante-Green, and RIDE Announce 244,000+ Fewer Absences in 23-24 School Year, Kick Off Attendance Matters RI 24-25 School Year Campaign
- What We Know About Chronic Absenteeism in Rhode Island flyer
- Attendance Leaderboard
- Attendance Tool (log in)
- Additional Resources, including Attendance Tool Overview
- DOWNLOAD AND SHARE! 2024 Attendance Tracker/Calendar for Students and Families (printable PDF) | Spanish
Recognizing the importance of this all-state approach, Rhode Island businesses are stepping up to encourage and reward student attendance. From exclusive coupons to special privileges, businesses such as Geoff’s Superlative Sandwiches, Wright’s Creamery, Knead Doughnuts, and Burger King have signed on to spread the message about attendance and promote good attendance habits. Troop/Lost Valley Pizza for example, will host a pizza party for Providence high school students with good attendance at the end of the school year.
We are calling on businesses across Rhode Island to support our students and promote good attendance! We encourage businesses to connect with local school districts. Businesses offering statewide attendance incentives are asked to contact Elizabeth.Russo@ride.ri.gov.
Thank you to the following businesses for supporting #AttendanceMattersRI:
- Wright's Dairy Farm
- Burger King
- Geoff's Superlative Sandwiches
- Troop/Lost Valley Pizza
- Knead Doughnuts
NEW! Long-Term Attendance and Achievement
Long-term chronic absenteeism has a compounding, negative impact on student performance. But getting students back on track makes a difference. Even if a student has been chronically absent in prior years, being in school the year of the assessment matters. And it's across all tests and all grades. What this tells us is that students can turn it around as long as they show up to school. In other words, a history of chronic absenteeism does not predict the academic future of our children. View the dashboard published October 2024 here.
The Rhode Island Community Dashboard
This attendance dashboard, available within RIDE’s Data Center, uses students’ home addresses to present chronic absenteeism on maps based on census tracts and block groups. RIDE has also mapped demographic information by census tract and block group to see whether certain characteristics of the community may be impacting student attendance, including:
· Percentage of families living under the poverty line
· Percentage of families living 185% under the poverty line
· Percentage of single-family households
· Percentage of population over 25 years of age with bachelor’s degree or higher
· Homeownership rate
· Percentage of households without internet
There are marked differences when users look at a school at the census tract or block group level. Where there are pockets of high absenteeism, school communities and other stakeholders can arrange walking school buses, plan coffee meetings with parents, target a media campaign, create incentives for students and families, and identify support services located in that area, among other efforts.
The Historical Absence Dashboard
This dashboard, located here, allows users to track chronic absenteeism rates by year, local education agency, school, grade span, gender, free and reduced lunch status, race, and whether or not the student is differently-abled and/or a multilingual learner.
Bar graphs depict chronic absenteeism in three ways:
· Frequently Absent: Absent between 10% and 20% of school days (between 18 and 36 days);
· Extremely Absent: Absent between 20% and 50% of school days (between 37 and 90 days); and
· Mostly absent: Absent more than 50% of school days (more than 90 days)
The Attendance Leaderboard
The leaderboard, available at www.ride.ri.gov/attendanceleaderboard, is updated daily, helping school leaders to identify attendance issues early and often. Users can see total student enrollment at each school, as well as both the number and percentage of students on track to be chronically absent. The dashboard captures students who have been absent for 10% or more of the school year so far, and numbers will fluctuate throughout the school year. The leaderboard also allows you to compare the current percentage of those on track to be chronically absent to the percentage of those chronically absent at the same time last year.
Achievement and Chronic Absenteeism Dashboard
This dashboard (found under “More Attendance Dashboards and Resources”) shows math and ELA performance on RICAS and SAT assessments by levels of chronic absenteeism. Users will see as chronic absenteeism increases, student proficiency and ELA declines. The dashboard allows users to filter by district, school, and various subgroups.
Real-time Attendance Dashboards
This set of dashboards (found under “More Attendance Dashboards and Resources”) lets users dig deep into real time data. The site refreshes daily. Users can examine changes from this year to last, examine attendance by multiple subgroups, look at monthly attendance trends, and track early dismissals and tardies.
2023-2024 Chronic Absenteeism Dashboards
This dashboard (found under “More Attendance Dashboards and Resources”) shows the number and percentage of students who are chronically absent so far this academic year. The figure is based on data that local education agencies submit to RIDE. Districts are expected to submit attendance to RIDE daily.
Did you know that every missed school day could impact a child' s future? You can make a difference! Join the #AttendanceMattersRI campaign and help spread awareness about the critical importance of regular school attendance. See graphics below this dropdown!
Facebook/Instagram/LinkedIn/Etc.
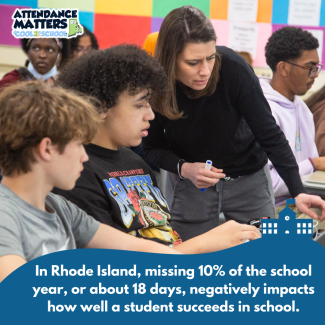
- In Rhode Island, missing 10 percent of the school year, or approximately 18 days, means a student is chronically absent. Research shows that this negative impacts how well a student does in school. Making sure your child is in class each and every day is one of the best ways you can help them get on the path to success. Remember, it’s #Cool2BeInSchool! #AttendanceMattersRI
- Attendance is a predictor of student outcomes. Research shows that chronic absenteeism is associated with a number of issues – including course failure, dropout risk, and lower achievement. Being absent makes it more difficult for students to succeed. Their #AttendanceMattersRI!
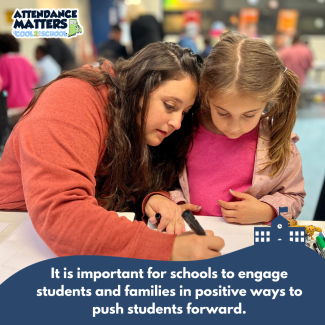
- Every day counts! For good attendance, it’s important for schools to engage students & families in positive ways, such as communication & having the right staff creating safe & welcoming environments. We all have a role in making attendance a priority. #AttendanceMattersRI
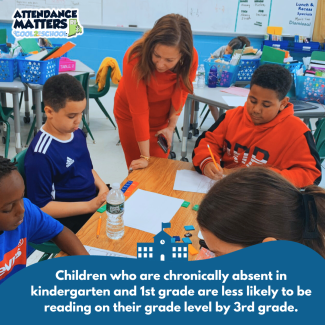
- #DidYouKnow? Children who are chronically absent in kindergarten and first grade are less likely to be reading on their grade level by the third grade. It is clear that AttendanceMattersRI.
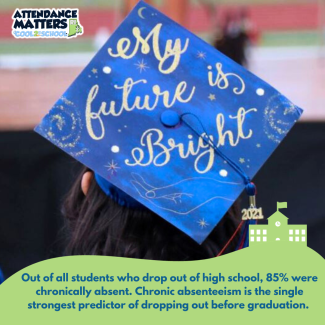
- #DidYouKnow? Out of all students who drop out of high school, 85 percent were chronically absent. This can be predicted as early as third grade, based on early elementary school attendance. Chronic absenteeism is the single strongest predictor of dropping out of school before graduation. #AttendanceMattersRI
- #DidYouKnow? Significant performance gaps exist for students who are chronically absent. Chronically absent students, on average, performed lower than their non-chronically absent peers by 19.9 to 26 percent on Rhode Island state assessments.
Twitter/X:
- In RI, missing 10% of the school year, or ~ 18 days, means a student is chronically absent. Research shows it negatively impacts how they do in school. Making sure your child is in class each day is one of the best ways you can get them on a path to success. #AttendanceMattersRI
- Attendance is a predictor of student outcomes. Research shows that chronic absenteeism is associated with a number of issues including course failure, dropout risk, & lower achievement. Being absent makes it more difficult for students to succeed. #AttendanceMattersRI
- Every day counts! To promote good attendance, it’s important for schools to engage students and their families in positive ways, such as through open communication and having the right support staff creating safe and welcoming environments. Each of us has a role to play in making attendance a priority. #AttendanceMattersRI
- #DidYouKnow? Children who are chronically absent in kindergarten and first grade are less likely to be reading on their grade level by the third grade. It is clear that #AttendanceMattersRI.
- #DidYouKnow? Of all students who drop out of HS, 85% were chronically absent. This can be predicted as early as 3rd grade based on early elementary school attendance. Chronic absenteeism is the single strongest predictor of dropping out before graduation. #AttendanceMattersRI
- #DidYouKnow? Significant performance gaps exist for students who are chronically absent. Chronically absent students, on average, performed lower than their not chronically absent peers by 19.9%-26% on 2023 Rhode Island assessments.
- Chronic Absenteeism Working Group Kickoff Deck
- Menu of Commitments
- Chronic Absenteeism in Rhode Island: What We Know
2024-2025 Student Spotlights
- Morgan, North Kingstown High School
2023-2024 Student and School Spotlights
Our students learn best when they're in school and engaged. Explore the following spotlights to see what school communities across the state are doing to show that Attendance Matters!


